
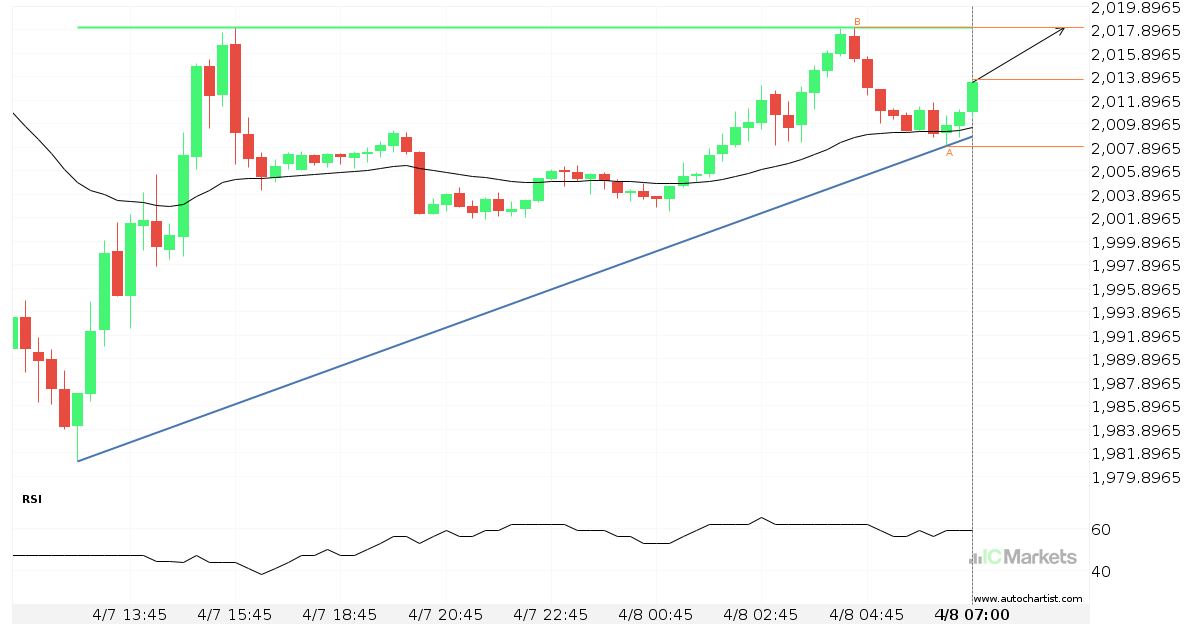
Either a rebound or a breakout imminent on US Small Cap 2000 Index
US Small Cap 2000 Index is heading towards the resistance line of a Ascending Triangle. If this movement continues, the price of US Small Cap 2000 Index could test 2018.0500 within the next 5 hours. It has tested this line numerous times in the past, so this movement could be short-lived and end up rebounding […]
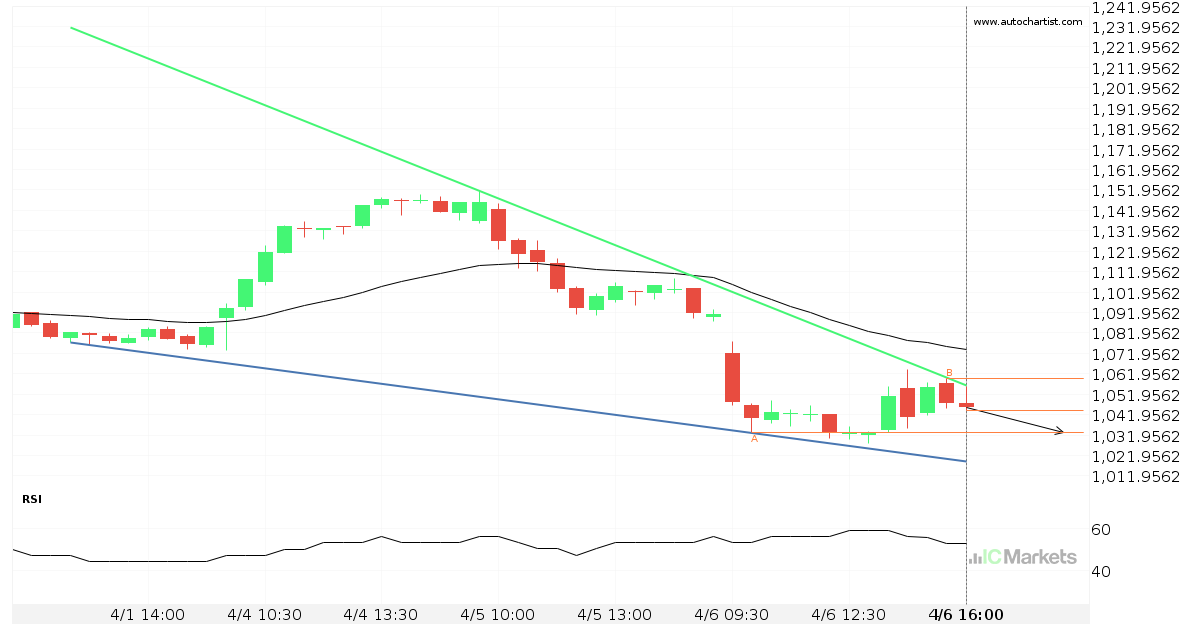
Tesla Inc. – getting close to support of a Falling Wedge
Tesla Inc. is moving towards a support line. Because we have seen it retrace from this line before, we could see either a break through this line, or a rebound back to current levels. It has touched this line numerous times in the last 6 days and may test it again within the next 7 […]
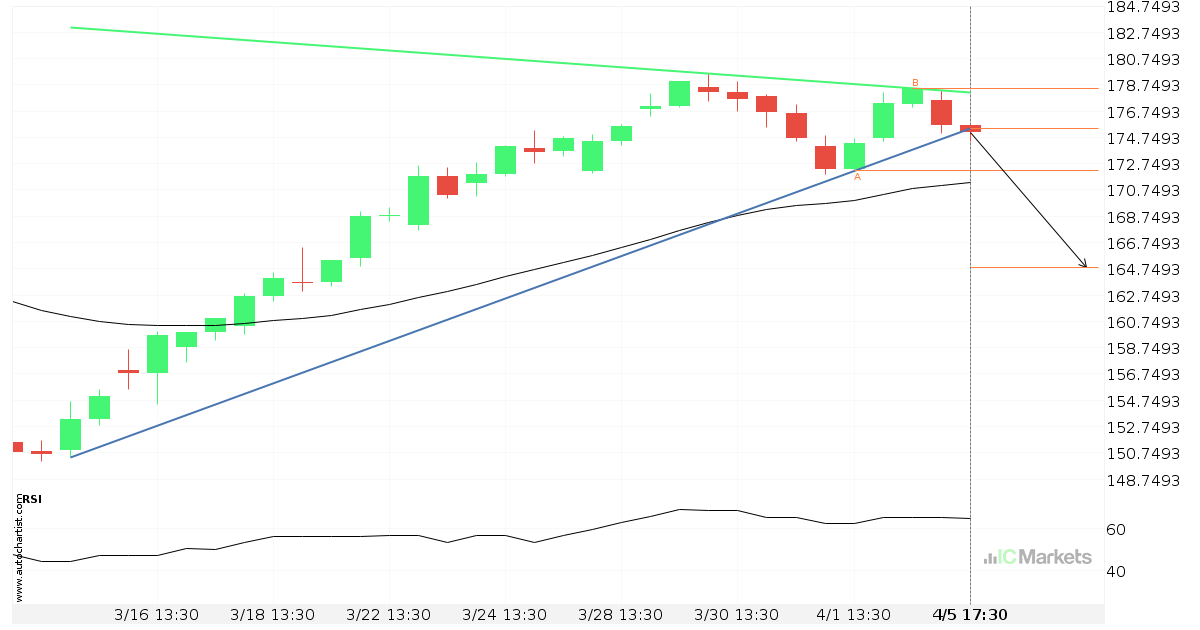
Should we expect a bearish trend on Apple Inc.?
The breakout of Apple Inc. through the support line of a Triangle could be a sign of the road ahead. If this breakout persists, we may see the price of Apple Inc. testing 164.8850 within the next 2 days.
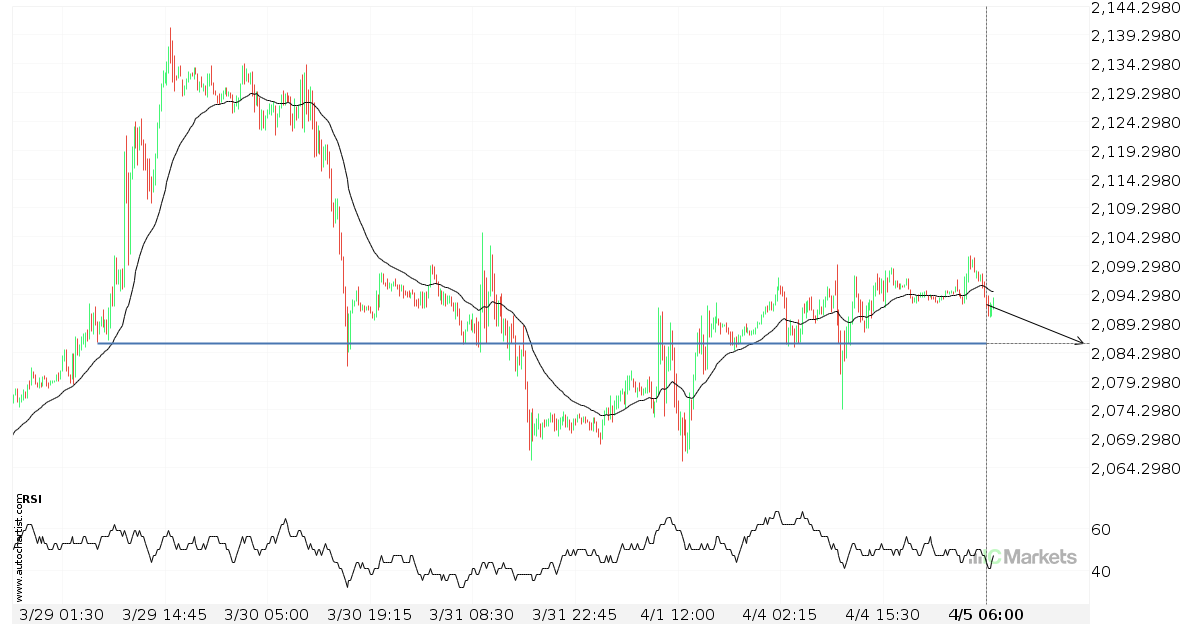
Either a rebound or a breakout imminent on US Small Cap 2000 Index
US Small Cap 2000 Index is heading towards a line of 2085.7700. If this movement continues, the price of US Small Cap 2000 Index could test 2085.7700 within the next 2 days. But don’t be so quick to trade, it has tested this line numerous times in the past, so this movement could be short-lived […]
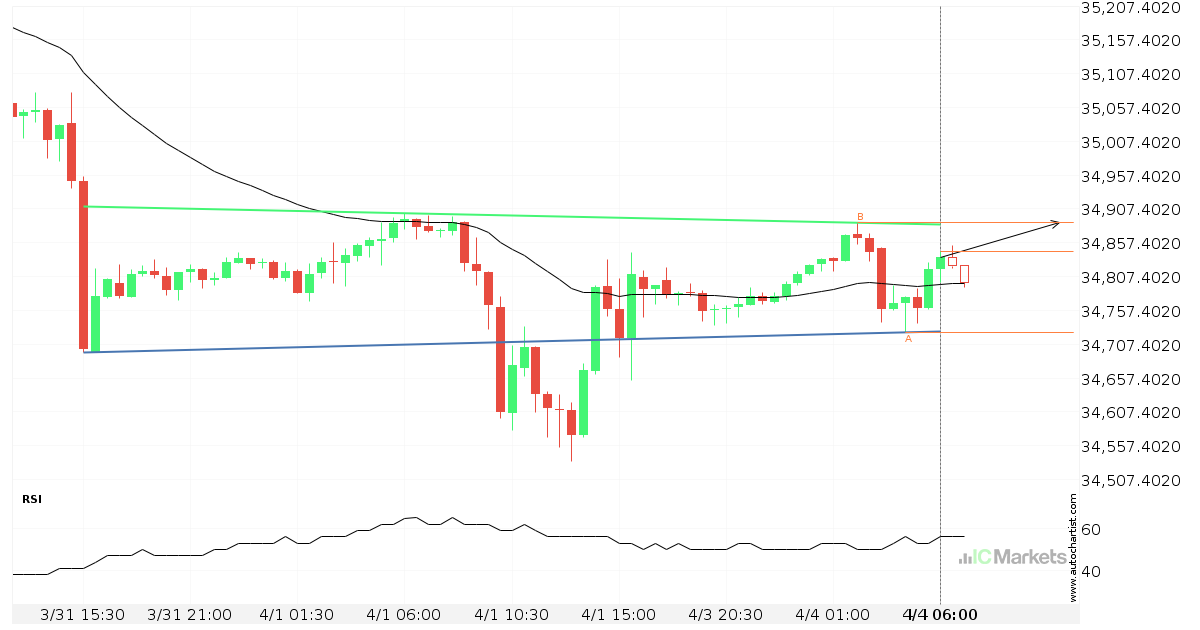
Will US Wall Street 30 Index have enough momentum to break resistance?
US Wall Street 30 Index is heading towards the resistance line of a Inverse Head and Shoulders and could reach this point within the next 10 hours. It has tested this line numerous times in the past, and this time could be no different from the past, ending in a rebound instead of a breakout. […]
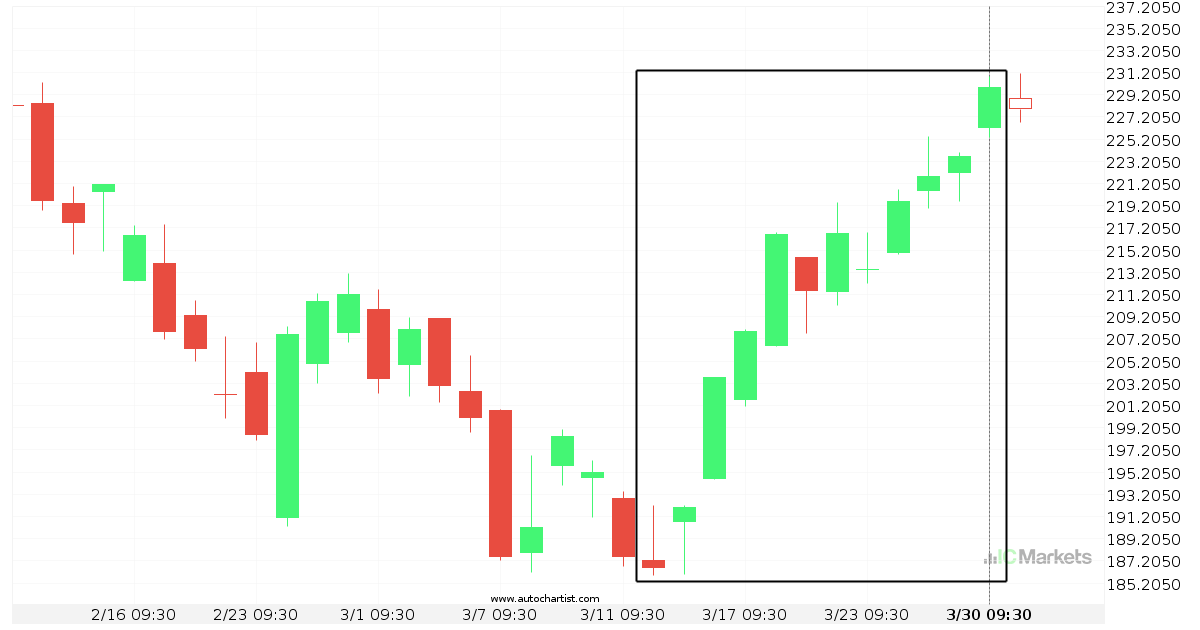
Huge bullish move on FACEBOOK
FACEBOOK has moved higher by 23.26% from 187.2 to 229.88 in the last 17 days.
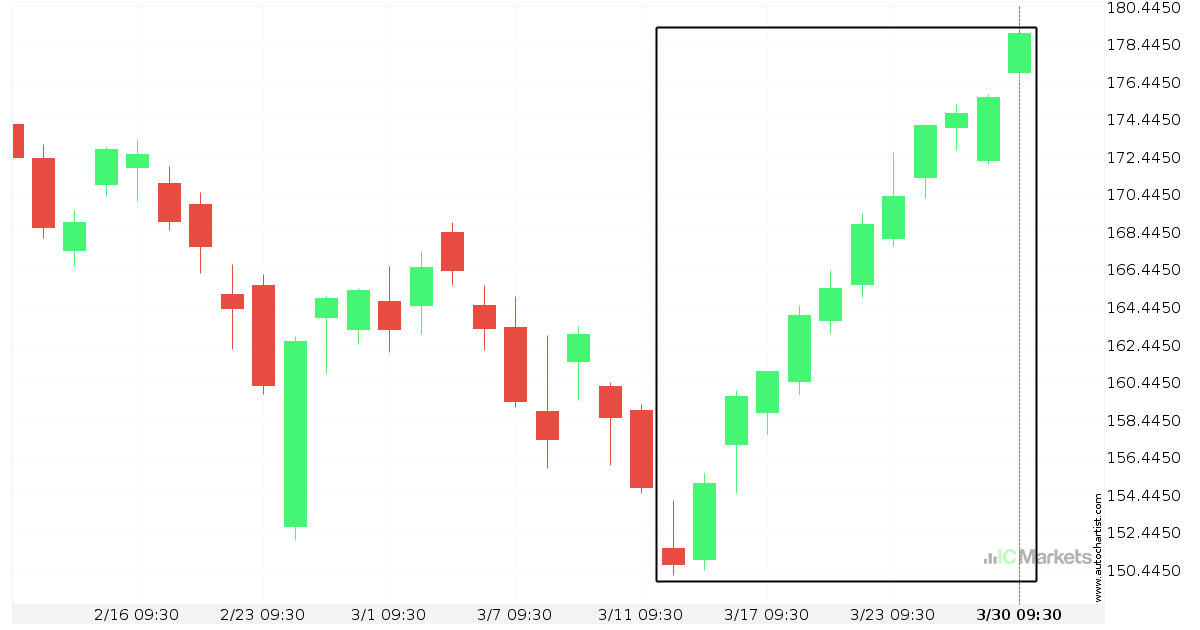
Apple Inc. experienced an exceptionally large movement
For those of you that don’t believe in trends, this may be an opportunity to take advantage of an exceptional 18.83% move on Apple Inc.. The movement has happened over the last 17 days. For those trend followers among you, you may think about riding this possible trend.
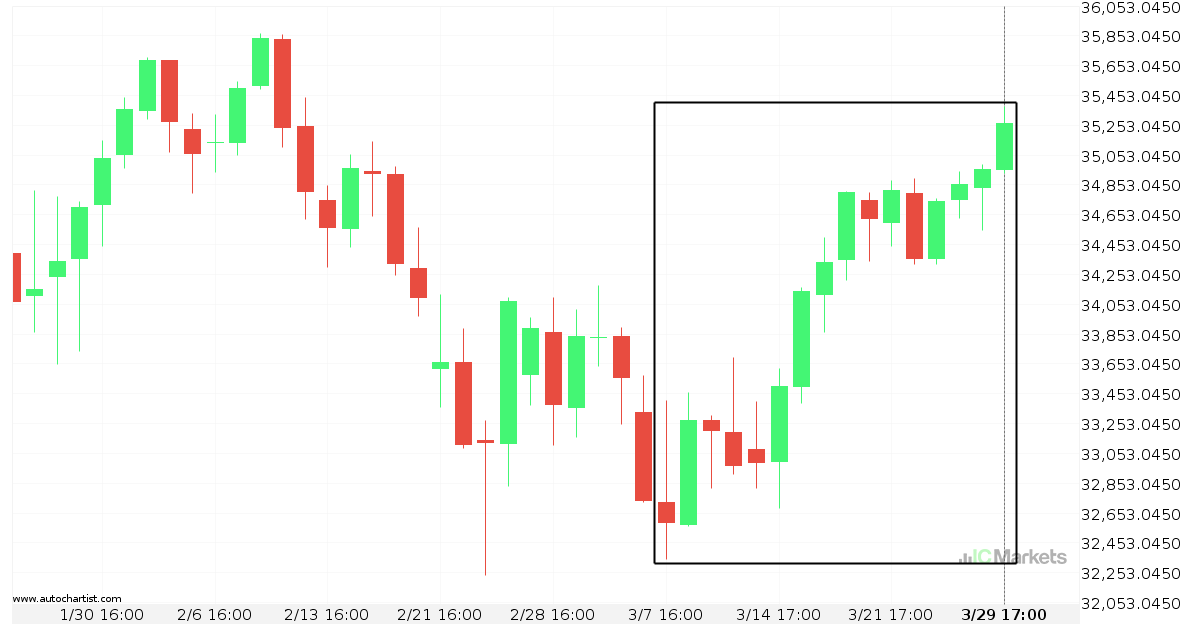
US Wall Street 30 Index is on its way up
US Wall Street 30 Index has experienced an exceptionally large movement higher by 8.29% from 32,722 to 35,281.4 in the last 23 days.
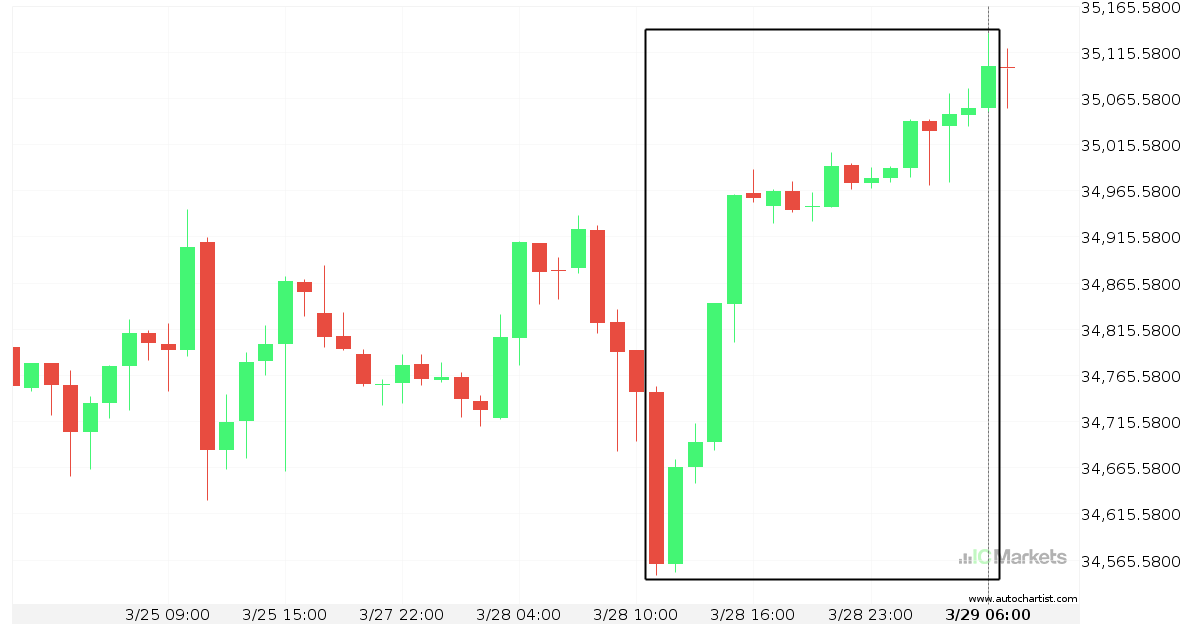
US Wall Street 30 Index is on its way up
US Wall Street 30 Index has experienced an exceptionally large movement higher by 1.56% from 34,747.5 to 35,099.6 in the last 19 hours.
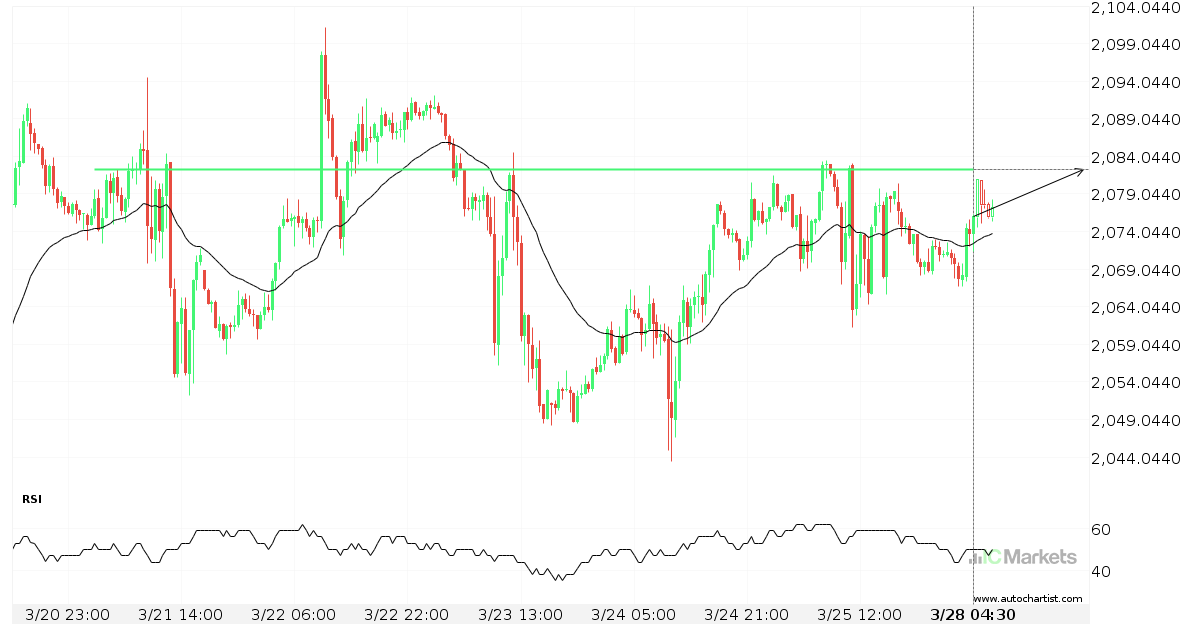
Should we expect a breakout or a rebound on US Small Cap 2000 Index?
The movement of US Small Cap 2000 Index towards 2082.2900 price line is yet another test of the line it reached numerous times in the past. We could expect this test to happen in the next 2 days, but it is uncertain whether it will result in a breakout through this line, or simply rebound […]